
Keep a one-page baseline
Model, firmware, idle temperature, and the SMART attributes you care about—one paragraph per disk. Update it when you swap cables, enclosures, or OS builds so comparisons stay honest.

Storage health · SMART · Temperature
Hard Disk Sentinel surfaces temperature trends, S.M.A.R.T. attributes, and disk self-tests in one place, so you can back up, replace, or investigate while you still have options.



Why readers keep monitoring software installed
This week
You do not need perfect dashboards—just a repeatable glance that compares this week to your baseline. The goal is noticing slope early, not chasing single numbers.
Model, firmware, idle temperature, and the SMART attributes you care about—one paragraph per disk. Update it when you swap cables, enclosures, or OS builds so comparisons stay honest.
Run a short self-test, confirm backups finished, and screenshot health summaries while the machine is calm. If something is already drifting, you want that evidence before luggage or Windows Update adds noise.
Log the date, the workload you were running, and whether cable or dock changed. If reallocations, pending sectors, or interface errors accelerate together, treat it as a backup-first event—not a forum debate.
By hardware
Same dashboard, different physics—mechanical disks telegraph surface and bearing stress; solid-state drives emphasize wear, thermals, and controller-reported errors. Skim both columns once, then bookmark the guide that matches your fleet.
Prioritize reallocated and pending sectors, acoustic changes, and latency stalls during light IO. Temperature still matters—especially in trays with weak airflow—but surface metrics usually speak first.
Watch wear indicators, unsafe shutdowns, media errors, and thermal throttling under sustained writes. Ignore mechanical-era folklore; NVMe may hide hotspot vs composite temps—trend one tool consistently.
Lexicon
Short definitions so forum threads and storage PDFs use the same words you already logged in your baseline file.
Firmware-reported counters—not a single pass/fail verdict. Compare slopes week to week, not one screenshot from Reddit.
The drive remapped weak spots into its spare pool. Occasional ticks happen; steady climbs deserve backup verification first.
Reads the firmware has not decided how to handle yet—watch alongside reallocations before declaring the disk “fine.”
Host writes vs storage endurance guidance—not an expiration date. Pair with media errors and thermals on SSDs.
Transport-layer problems—cables, docks, chipsets—often masquerade as “bad disks” until you simplify the chain.
Age and duty cycle context for every other metric—five calm years read differently than five oven summers.
Go deeper with normalized vs raw columns and storage naming quirks: Understanding SMART attributes
Guides
Features, maintenance checklist, workflow, and connectivity—easy to bookmark and share.
Start here
Independent guides for HDD, SSD, USB/NAS, and alerts. Software itself is only from the official publisher.
Pending sectors, noise, and when CHKDSK is not a SMART substitute.
Open topic →
TBW pacing and why peak temperature during writes matters more than idle.
Open topic →
Bridges that hide attributes — what you can still trust.
Open topic →
Read the warning, copy data first, diagnose second.
Open topic →
Triage
Stutters, mystery corruption, and copy errors do not always show up as reallocations. Widen the investigation in a fixed order—so you replace cables before you replace careers.
Swap SATA leads, try another USB port, and direct-attach shucked disks before assuming NAND or platters failed. CRC and interface errors often clear when the chain does.
Bit flips during copies, filter drivers, and beta filesystem tweaks masquerade as “bad disks.” SMART can stay flat while checksums scream—cross-check before RMA.
Weak rails and thermal throttling produce reset loops and write tearing—sometimes visible as interface bursts or temperature cliffs, sometimes not. Note room temps and PSU age in your baseline file.
Modern drives remap weak sectors quietly until a threshold breaks—monitoring exists to surface that drift while you still have a clone window.
Decisions
Headline health percentages flatten nuance. Use slopes and corroborating attributes, then let backup readiness pick the pace—not forum urgency.
Flat or slowly drifting metrics after cable verification—log weekly, compare to your baseline file, and keep backups current. One-off spikes during known heavy tasks are normal.
Reallocations or pending sectors accelerate, or interface errors persist after path swaps—refresh backups, budget a replacement, and migrate hot data first. You are buying calendar time, not panicking.
Uncorrectable errors, checksum failures on known-good files, or slopes that outrun your restore window—treat the disk as production-blocked. Clone or image first when the OS still boots cleanly.
Tune alert noise so real steps stand out: warning levels & alerts · first-month cadence
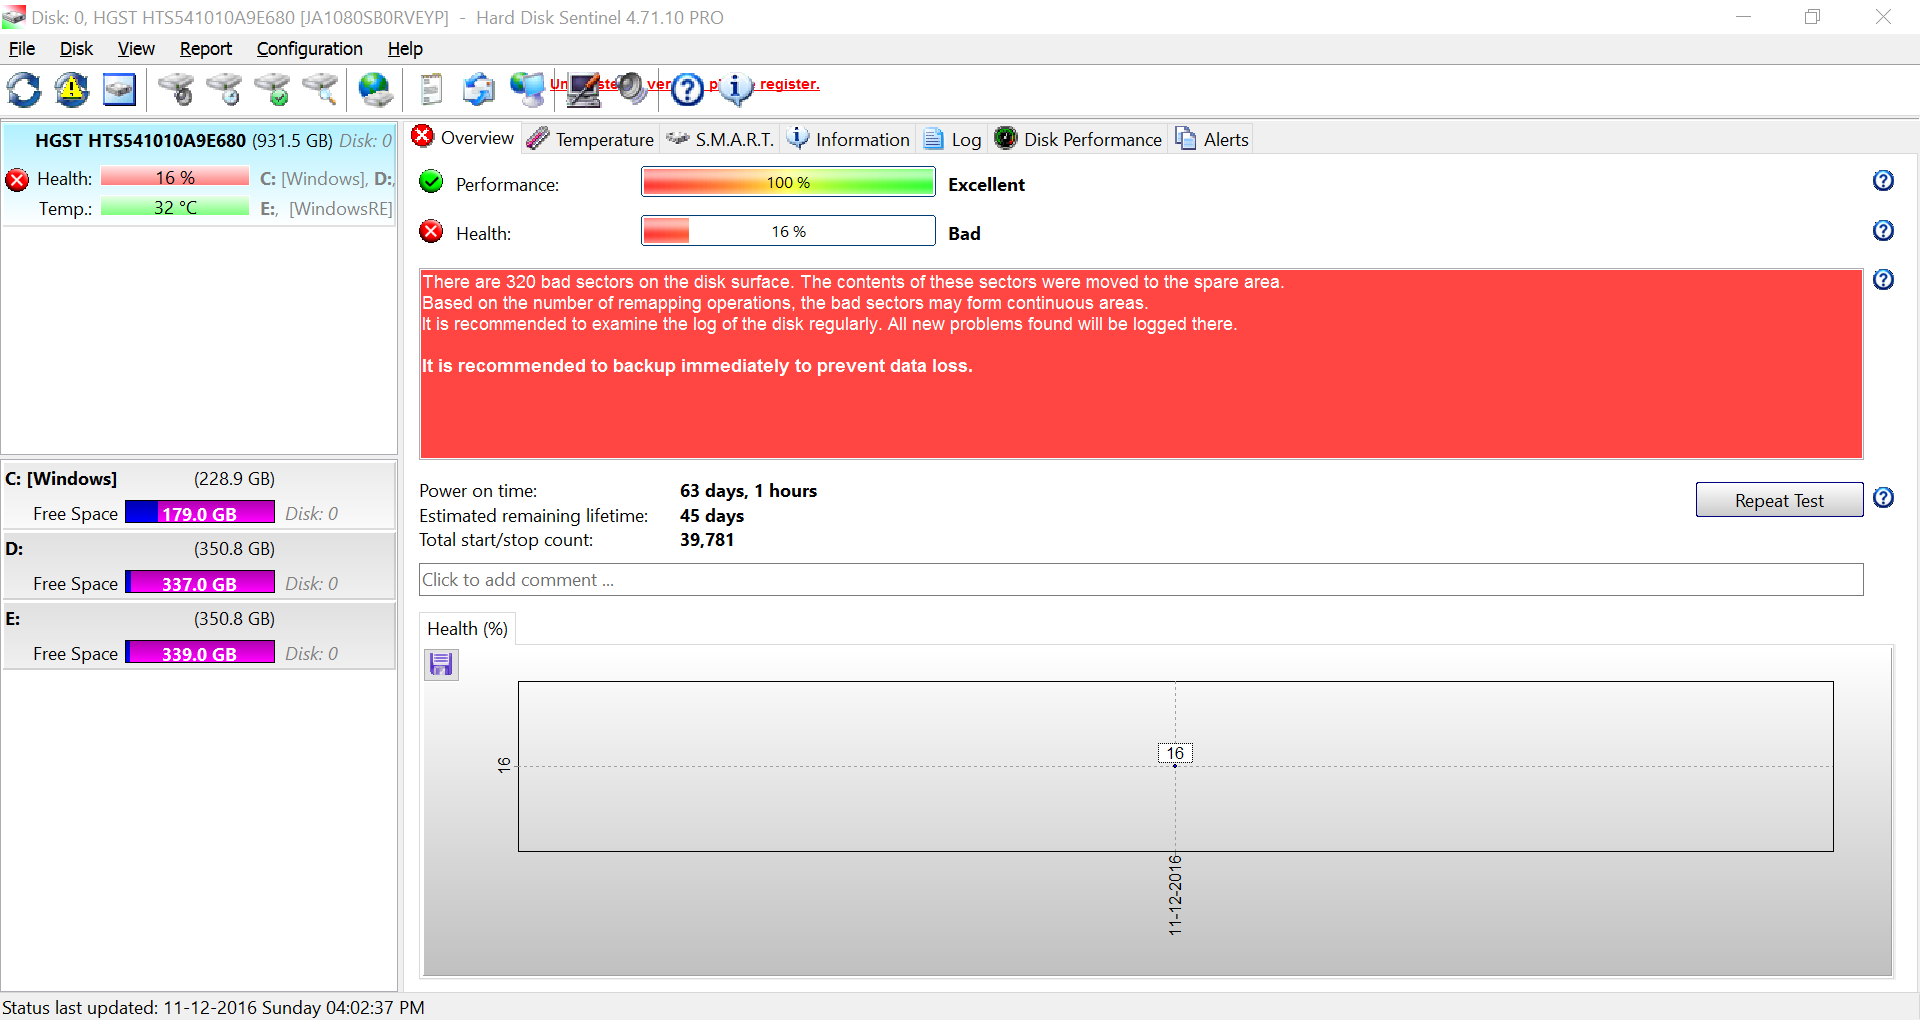
Still frames from typical installs—drive list, partitions, and monitoring panels as they appear on desktop Windows.

Onboarding
Software is instant; trust builds slowly. Use this cadence so graphs mean something when a metric finally wiggles—you will compare against your machine, not a screenshot from 2019.
Week 1
Let the first poll finish; rename drives in your head to match physical stickers. Note which tray is scratch vs archive—future alerts become actionable.
Week 2
Export SMART text or jot peak idle/load temps after normal work sessions. One paragraph per disk beats a folder of mystery screenshots.
Week 3
Raise thresholds that ping every laptop nap; tighten anything guarding finance or master photo trees. Pair desktop alerts with one weekly calendar reminder for NAS appliances.
Week 4
Restore a random folder from backup to a temp path. Monitoring buys foresight—backups only count when restores work.
Field notes
Expectations shift by chassis airflow, who shares the PC, and whether disks sleep in a closet NAS. Adjust baselines and alerts instead of chasing one global temperature number.
GPU waste heat stacks on NVMe under the slot. Log peaks during real sessions—patches and exports—not idle desktop temps after reboot.
Kids and guests add surprise installs and sleep settings. Keep one conservative alert everyone understands—and silence predictable benign windows after you document them.
Seasonal room temperature moves averages more than firmware updates. Note ambient when graphs jump—often dust or fan curve, not sudden platter cancer.
Not endorsements—common timelines we see when people finally graph temperature and SMART together.
Freelance editor
Spiked temps during renders—not sudden failure. Improved case airflow, staggered jobs, replaced thermal pads yearly.
Outcome: stable SMART, quieter fans, fewer thermal throttles.
Remote worker
Interface errors climbed—swapped cable and dock chipsets before assuming platter death.
Outcome: errors vanished; disk retained spare sectors untouched.
Small office NAS
Latency outliers preceded SMART trips—monitoring plus scrubs caught the disk during business hours, not Friday night.
Outcome: orderly RAID rebuild instead of panic restore.
Student budget build
Power-on hours were honest—wear was not. Monitoring exposed realloc growth during semester crunch; cloned to a new disk during reading week instead of mid-exam.
Outcome: cheap lesson—always graph counters before trusting surplus drives with sole copies.
Photo archive keeper
Infrequent spin-ups masked creep until annual verification—monitoring during idle scrub caught pending sectors before the Lightroom catalog took collateral damage.
Outcome: rotated archives early; kept originals on two media types.
Dual-boot tinkerer
Partition experiments stressed the partition map—not hardware. SMART stayed flat; filesystem checks fixed ghosts. Logging avoided an unnecessary RMA.
Outcome: separated software panic from disk panic.
Practice
Short exercises—none of them destructive—that turn monitoring from wallpaper into muscle memory. Pick one per week if you are busy; stack them before upgrades or travel.
Open the overview, confirm tray icon state, scan highest temperature from the last seven days, and note whether any attribute changed more than your noise floor. Stop there—trends accumulate; perfection does not.
Schedule a short self-test on a quiet evening after cable checks. Log pass/fail next to your baseline file—extended tests stay reserved for when SMART or latency already whispers.
Pick a random project directory from backup; restore to a temp path and open a few files. Monitoring tells you when risk rises—only restores prove the backup is real.
If the same threshold fires during scheduled backups every night, adjust windows or hysteresis once—then leave SMART slope alerts alone. The goal is fewer ignored notifications, not zero notifications.
First run
Use setup checklists, verify installers when checksums exist, and walk the first-session checklist so week-one graphs mean something.
Straight answers—full list on the dedicated page.
Short bursts under load are normal. Sustained highs shrink margin—compare against your own baseline and chassis airflow, not someone else’s screenshot.
No—NAND wear, thermal throttling, and controller quirks remain. The signals differ from spinning rust, but they still benefit from trends.
Investigate rate of change and correlating attributes—single-point noise happens; slopes do not lie. When unsure, refresh backups first.
No—RAID handles some hardware faults, not accidental deletes, malware, or silent corruption that mirrors across disks. Keep offline or versioned copies of anything you cannot recreate.
Sensor placement, polling intervals, and composite vs. hotspot readings diverge—especially on NVMe. Pick one tool and watch trends over time instead of chasing identical numbers.
Let the first full poll finish; label enclosures to match on-screen IDs; jot idle and typical-load temperatures during real work. Log odd readings before changing hardware—you want a story, not a single number.
Prioritize replacement when reallocations or pending sectors accelerate, uncorrectable errors persist after ruling out cables, or checksum tests fail on files you trust. If the trend outruns how fast you can restore from backup, order a spare—even when headline health still looks “okay.”
Long-form guides with tables of contents—pick a topic and read without scroll-tax.
Baselines, SMART attributes that matter, and when to escalate from observation to action.
Continue readingWear leveling, TBW reality checks, and thermal behavior under sustained IO—not legacy HDD rules reused blindly.
Continue readingNoise patterns, latency ghosts, backup drills—recognize failure modes before SMART catches up.
Continue readingWhy averages beat snapshots, how hotspots differ from headline temps, and when thermal margins shrink silently.
Continue readingExplore
Guides, workflow pages, and the full article list live on dedicated URLs—bookmark what you reopen often.
Whole-system context
SMART and temperature charts describe the storage device—not every path your bits traverse. When symptoms and graphs disagree, widen the investigation instead of cycling cables forever.
Faulty memory flips bits during copy, compile, and checksum operations—SMART can stay quiet while archives rot. Run targeted RAM tests when corruption appears random across disks.
Weak PSU rails or flaky surge strips cause reset loops and write tearing—interface error bursts may be the only disk-adjacent clue. Rule out power before blaming NAND.
Filter drivers, encryption, and beta filesystem tweaks surface as “disk problems” in apps while SMART stays green. Validate with storage updates and clean-boot trials.
Ransomware and accidental deletes do not wear out platters—your disk health panel cannot warn about policy gaps. Pair monitoring with offline backups and permission hygiene.